Data Management & Visualization (draft)

Transforming data into decisions
Our tools and expertise make a difference to our clients, whether they aid in conducting evaluations, help to gain insights, or ultimately drive solutionsData Management: Data serves as the cornerstone for an environmental project. Our experts manage and apply data to scientific and engineering challenges and will treat your data as one of your most valuable strategic assets. READ MORE
Data Analysis and Statistics: Terraphase uses a wide array of tools to perform data analysis to meet project objectives. We transform environmental data into work products that support risk management decisions and guide investigations. READ MORE
Data Visualization: Terraphase excels at simplifying complex data through thoughtful data visualization in two, three and four dimensions. READ MORE
Geographic Information Systems (GIS): Our extensive experience utilizing geospatial data enables us to gain deeper insights about contaminated sites. Our track record with ESRI’s GIS Software platform make us a trusted Business Partner capable of deploying custom ESRI platform solutions for our private and public clients. READ MORE
Drone Aerial Photography: Drones, or “unmanned aerial vehicles” commonly referred to as UAVs, allow for the acquisition of data in remote or hazardous areas that are difficult to reach and can expedite data acquisition needs. READ MORE
Computer Aided Drafting and Design (CAD): Terraphase employs AutoCAD Civil 3D software to plan, design, produce, and manage projects using 3D design modeling. READ MORE

Project Descriptions
Mobile Data & Mapping
Smart data collection tools help guide soil removal project from the field
Read MoreKey Elements
- Real-time GPS data
- ArcGIS Online
- ESRI Collector
- Enterprise GIS
- Mobile forms
- Microsoft OneDrive™
Benefits
- Maximize efficiencies in data collection, storage and reporting
- Optimize investments in data
- Eliminate transcription errors
- Check/validate data entry
- Yield field note uniformity
- Easily find and report data
- Secure data sharing and access
Challenge
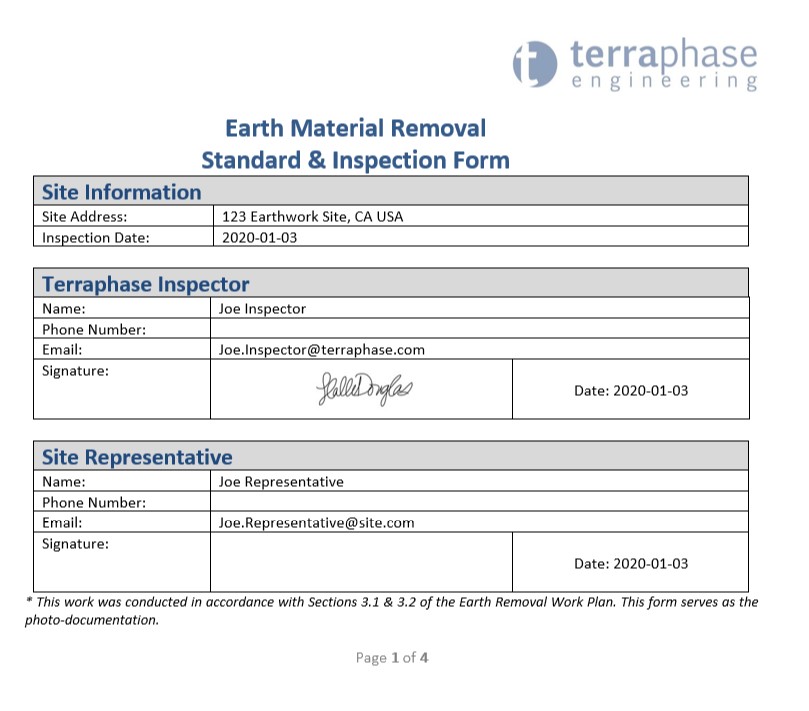
When activities at a packaging machinery manufacturer’s facility inadvertently impacted the soil of a large agricultural site , Terraphase was contracted to oversee and monitor earth removal activities at the impacted site. Terraphase determined an approach that would provide real-time data to help guide remedial activities on a day-to-day basis, with the goal of producing a defensible record of activities and data would be necessary.
Solution
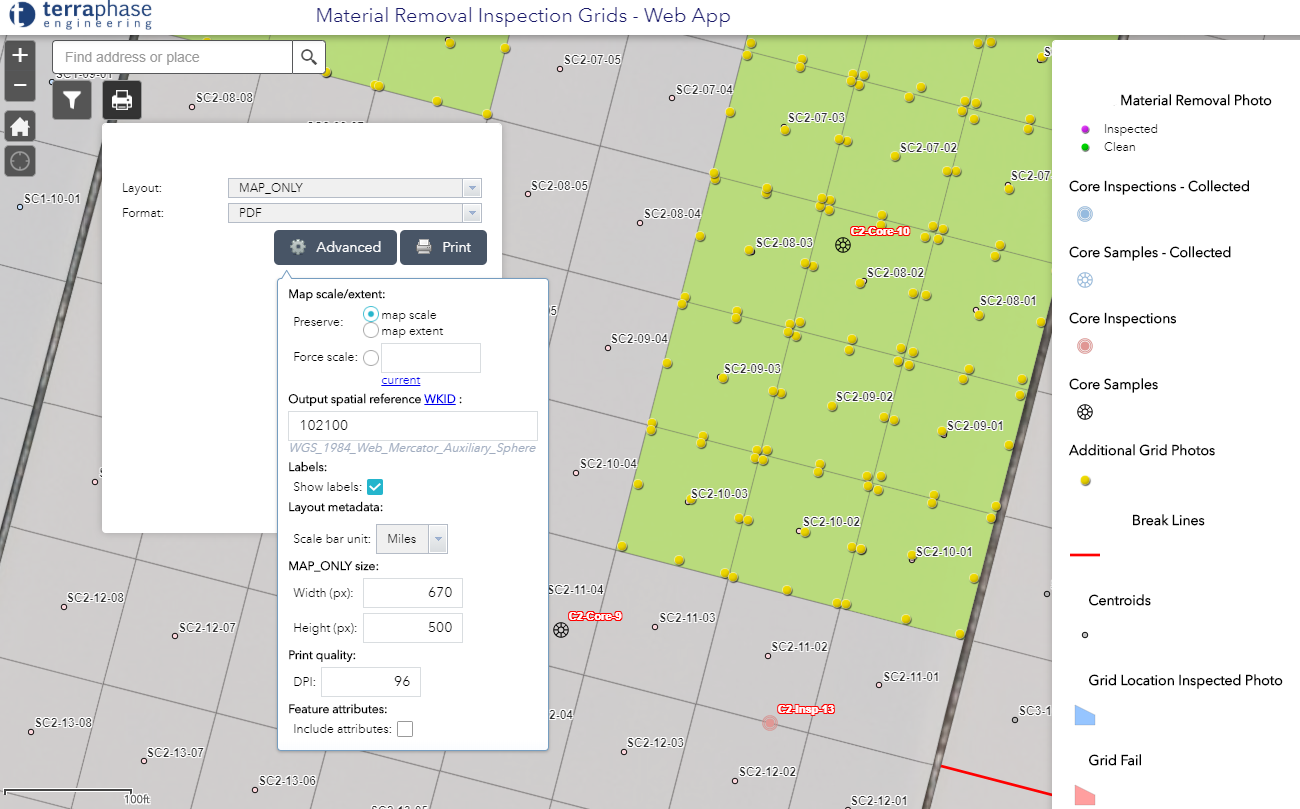
By implementing a smart data collection approach utilizing interactive mapping, visual grid sampling, on-site sampling results, and uniform daily field reporting, Terraphase has been able to achieve the client’s goal by sharing data in real-time for on-the-spot decision making purposes and reduced field time.
- Intelligently collected data in the field on a mobile device to provide uniformity and validity of notes
- Effortlessly produced formatted daily reports delivered electronically to the client via email inboxes and/or secured OneDrive folders
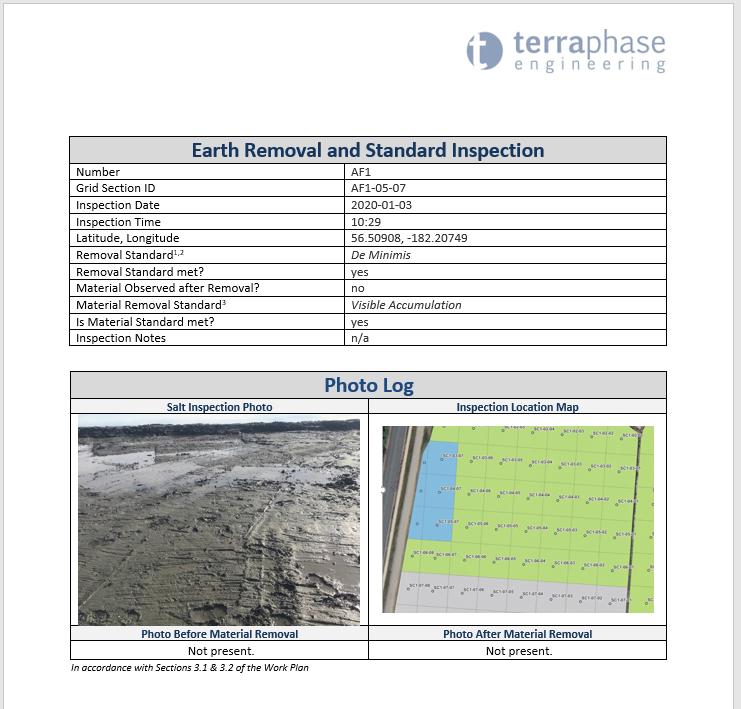
- Reviewed real-time data online at the office, printed maps, and produced a defensible record of daily activities and data
Key Elements
- Geographic Information Systems
- FAA Part 107 Licensed Staff
- Pix4D
Benefits
- High resolution real-time imagery
- Cross physical barriers, dense vegetation, wetlands and natural hazards
- Thousands of acres in a single day
- Photogrammetry
- Digital elevation models and georeferenced orthomosaics
Challenge
Phase 1 ESAs may be difficult in situations where Environmental professionals have limited access, due to either the size or condition of the subject property. In addition, finding historical aerials younger than several months old is not often possible.
Solution
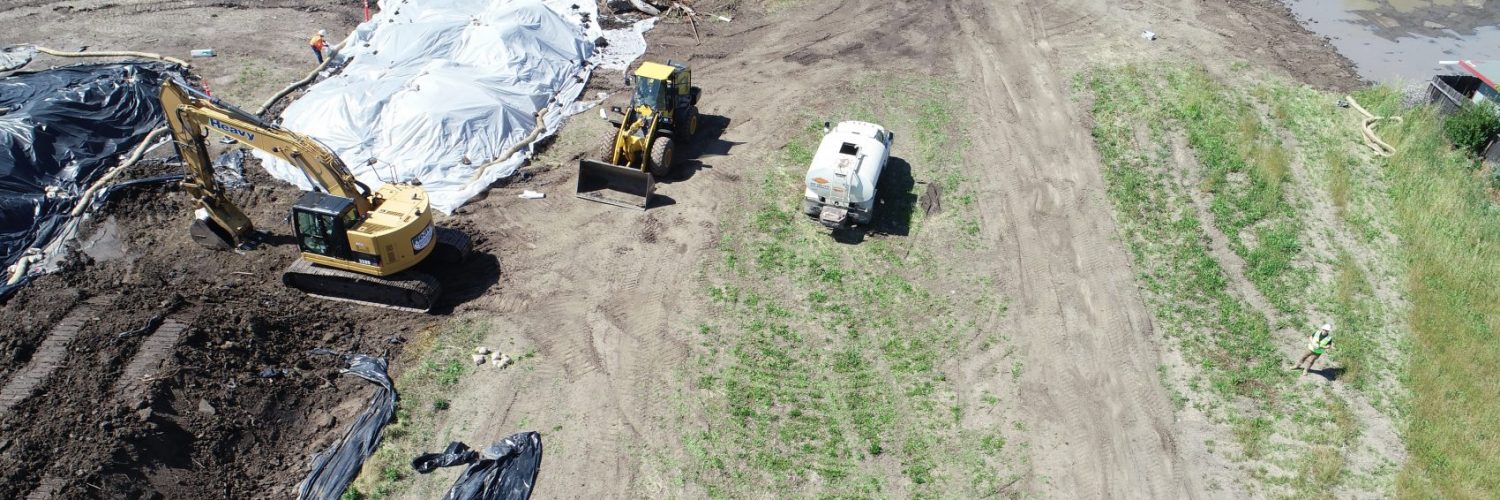
Terraphase has cost effectively deployed unmanned aerial systems (UAS), aka “drones” in this situation. A UAS flight provides a high-resolution current “bird’s eye views” of the property as well as video footage, as the drone can be flown into areas over physical barriers to vehicular or pedestrian access, dense vegetation, wetlands and natural hazards. Fixed-wing drones can cover thousands of acres in a matter of hours. Quad-copter drones can easily cover smaller areas and more adeptly navigate certain features. Using drone outputs of several thousand small overlapping geotagged images, application of photogrammetry permits the construction of both 2D and 3D maps, digital elevation models and georeferenced orthomosaics that are then used in our Geographic Information Systems (GIS) as geotagged imagery for report figures.
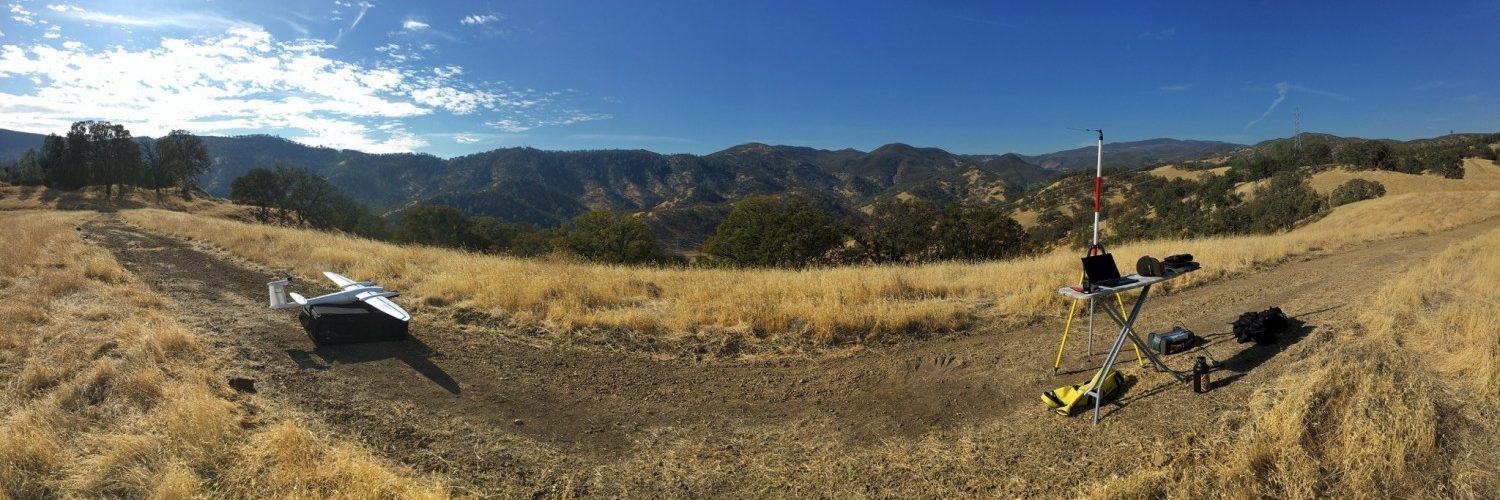
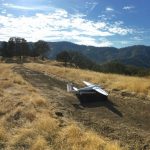
Launch site for fixed-wing drone flight over 2,000 acre site with rugged terrain in support of Phase I ESA
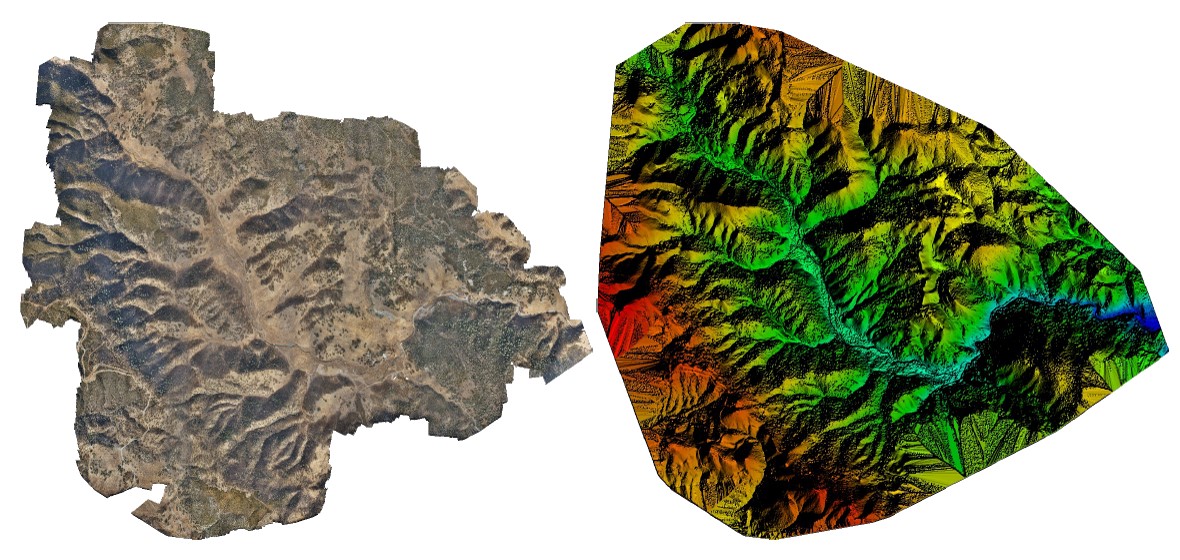
Orthomosaic and the Digital Surface Model(DSM) processing previews
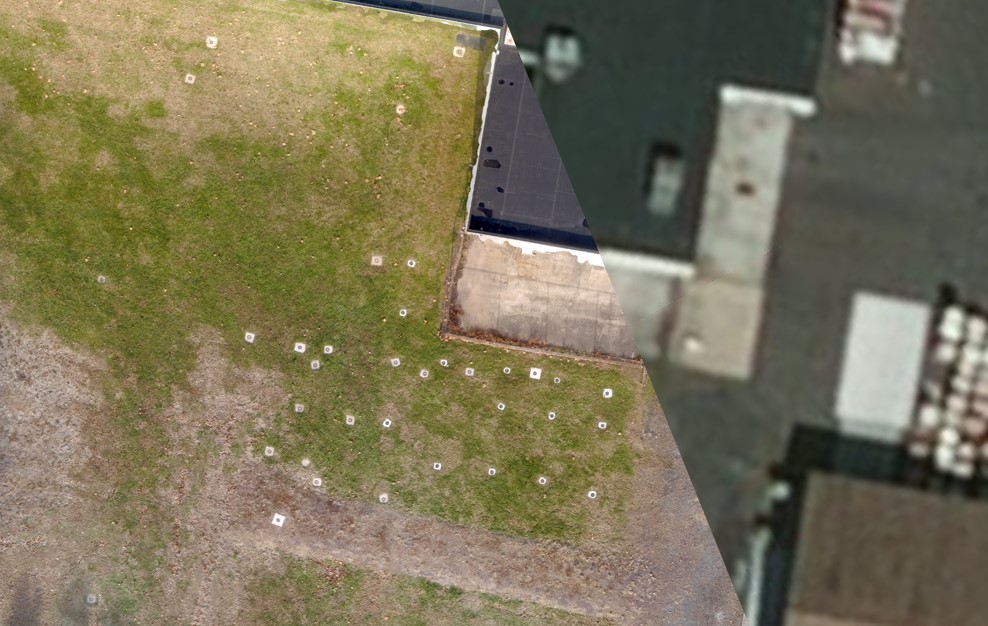
Side by side comparison of stock imagery compared to high resolution drone imagery of a site showing well pads that were part of a groundwater investigation
Key Elements
- Microsoft PowerApps
- Microsoft Flow
- SharePoint
Benefits
- Automated communication between stakeholders, project managers, and sampling team
- Cost reduction in project management hours
- Compliance timestamps for outlet preparation
- Fewer cancelled sampling opportunities
- Simple progress report data
Challenge
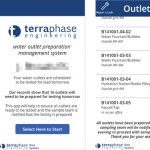
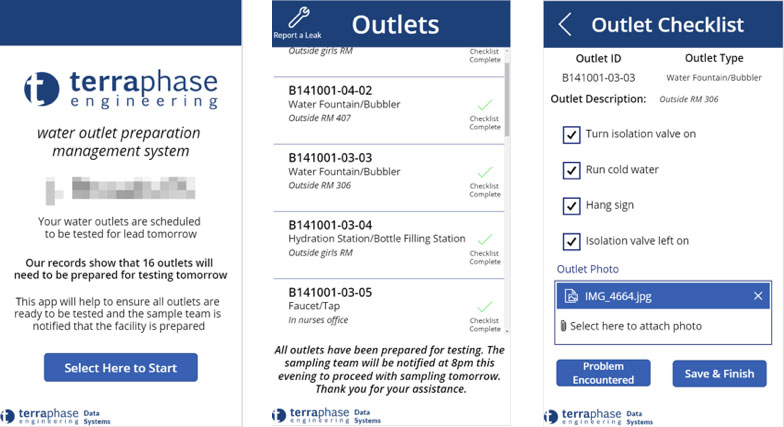
Testing for lead in drinking water across multiple school districts demands coordination and preparation on a massive level. Preparing water outlets for early morning testing requires a checklist to be completed on site prior to testing, and a record of the preparation be completed. The most cost-effective way to accomplish this is to have facility staff complete the preparation work the day before testing is required. However, the communication channels in coordinating facility staff to complete these tasks can quickly become a pitfall in these projects.
Solution
Terraphase designed a custom mobile application and automated messaging system to coordinate water outlet preparation for all schools. The day before water outlet testing is scheduled, facility managers and building engineers are contacted via the automated messaging system. The message provides them with instructions to use the mobile app and gives them a checklist for each water outlet scheduled to be tested. Problems with the outlets can be reported via the checklist. In the evening, our clients and the sampling team are automatically notified of the status of the water outlets, and sampling proceeds based on those notifications.
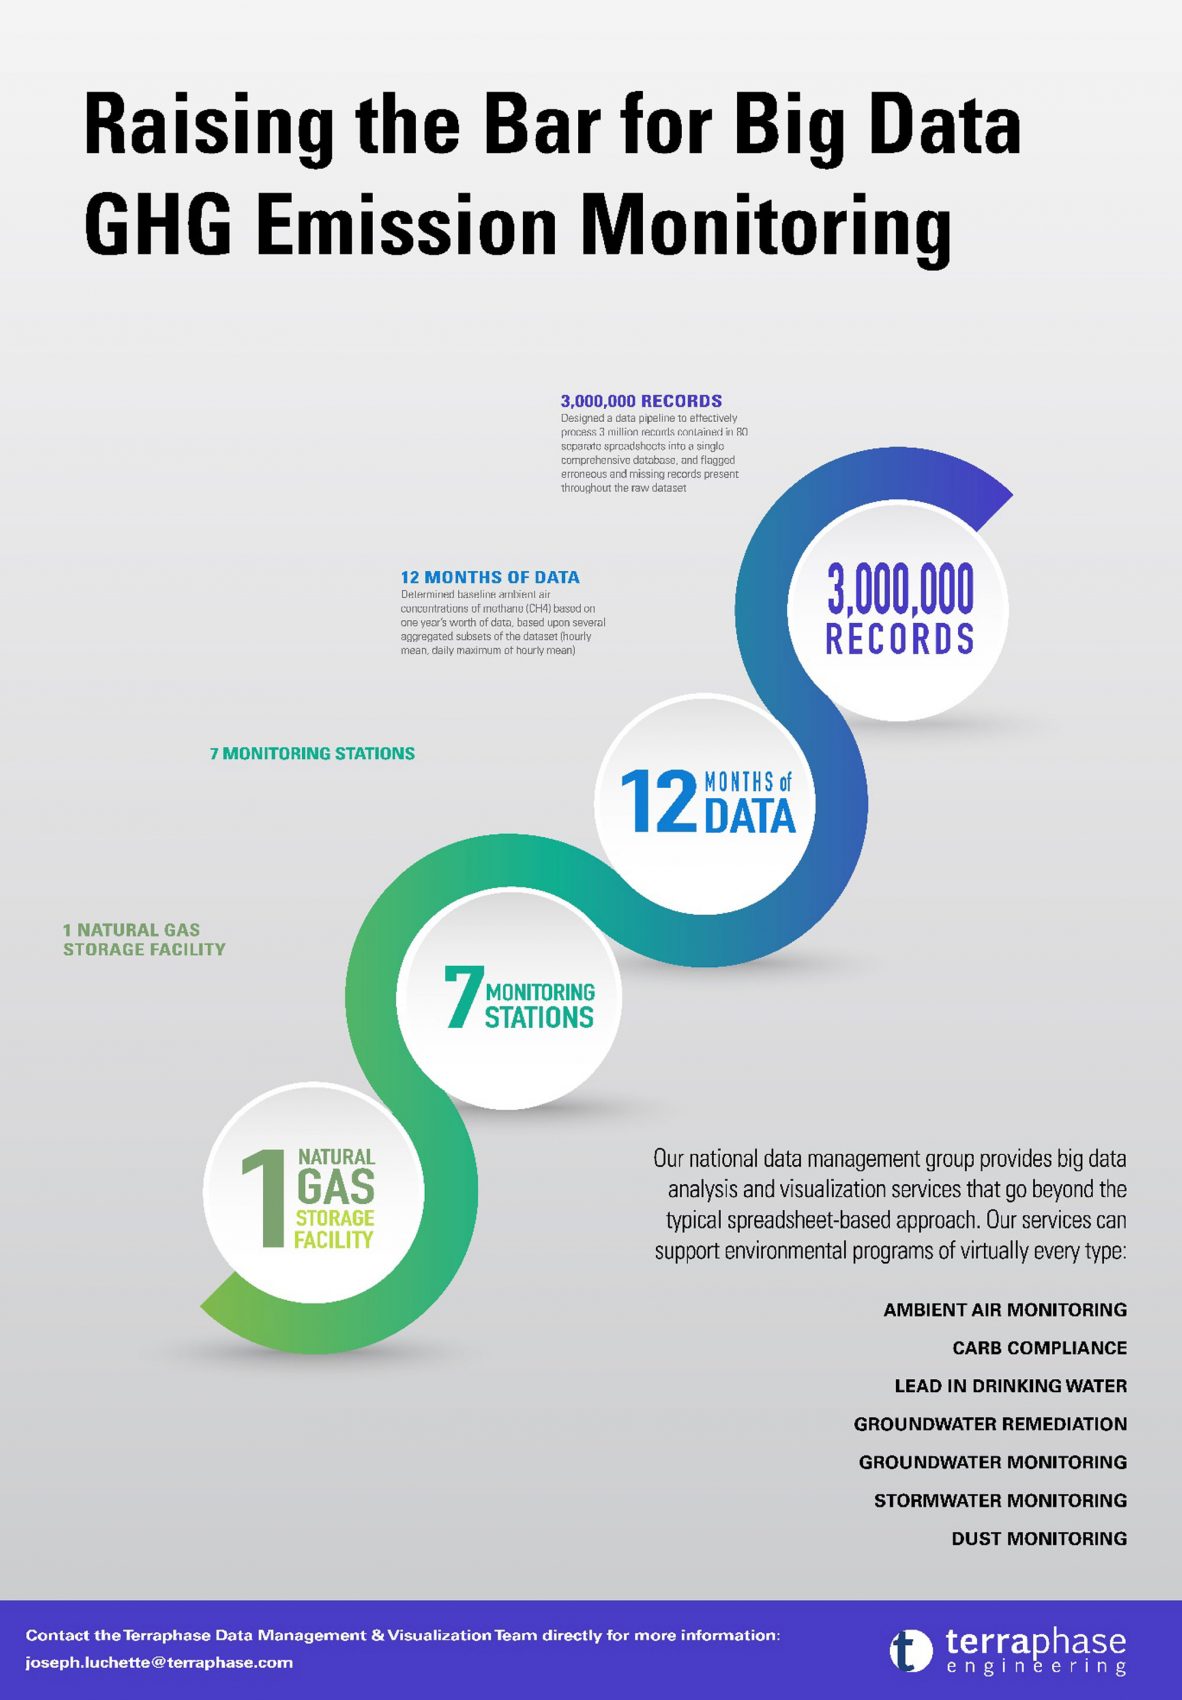
Data Processing and Analysis for Greenhouse Gas (GHG) Emission Monitoring at a Natural Gas Storage Facility
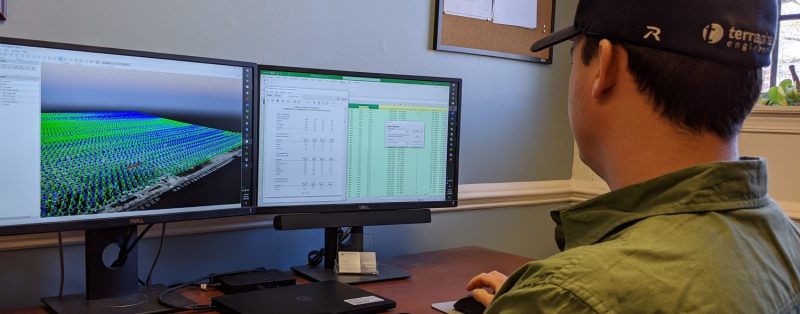
Go beyond Excel (or suffocate!)
Read MoreKey Elements
- Python programming
- SQLite
- Bokeh Plotting Library
Benefits
- Automated Data Processing
- Repeatable Exploratory Data Analysis (EDA)
- Data Visualization
- Quality Assurance
Challenge
Natural gas storage facilities are required to conduct continuous monitoring and establishment of baseline ambient air gas concentrations. Our client needed us to determine baseline ambient air concentrations of methane (CH4) based on one year’s worth of data collected at multiple monitoring stations surrounding their natural gas storage facility. Data was provided by the client in the form of MS Excel workbooks, each with over 500,000 records, totaling approximately 3 million records. The dataset contained numerous erroneous or missing records, and to calculate an accurate baseline value for each location, a series of complicated calculations had to be performed. Although not impossible, accurately performing this data processing and analysis only in MS Excel and Access would have been difficult, tedious, and not easily repeatable.
Solution
The Terraphase Data Team took an innovative approach to solving the problem, using in-house developed Python scripts to process the raw data, import the data into a SQLite database, and perform exploratory data analysis (EDA). This allowed the data to be reduced, reworked, and presented comprehensively in preliminary form for the first time since it began being collected over a year before. With that critical step complete, once all the data issues were known, the necessary calculations could safely be run to establish baseline concentrations for several scenarios. Detailed data visualizations and summary tables were also produced for presentation to the client and regulators. To assure the quality of the deliverables, subsets of the calculations were performed using Microsoft Access databases as a Quality Assurance step for the Python/SQLite workflow.